What is the moving average crossover strategy and how is it used?

Moving averages (MAs) are among the most widely used tools for analyzing price charts and identifying market trends. The indicator is applied across various markets, including crypto, stocks, and forex.
Crossovers on price charts can signal potential bullish or bearish moves. This article explains how the moving average crossover strategy works and evaluates its reliability.
Understanding the moving average crossover strategy
The moving average crossover strategy is a trend-following method used in technical analysis. It identifies potential market opportunities by analyzing price patterns. A moving average represents the average price of an asset over a defined period, helping filter out noise and highlight broader market trends.
As new data arrives, the oldest prices drop from the calculation. This continuous update is why the average is considered “moving.” A simple moving average (SMA) is the most basic type, calculating the average price over a set period, usually measured in days.
More advanced types, such as the exponential moving average (EMA), prioritize recent price data. The MA crossover trading strategy can use both SMAs and EMAs to identify shifts in market momentum.
How MA crossovers are formed and what they mean
On analytical platforms such as Glassnode and TradingView, moving averages appear as lines on a chart. Different time periods can be applied to support market analysis. Moving averages are typically categorized by time interval:
- Fast moving average (MA) – for shorter intervals
- Slow moving average (MA) – for longer intervals
A crossover happens when these lines, representing different time intervals, cross each other. This may signal that recent momentum is strong enough to shift market direction.
The logic is straightforward: the slow MA reflects established price levels, while a crossover by the fast MA suggests a potential shift away from that pattern and the start of a new trend. Here’s how crossovers look on a chart:
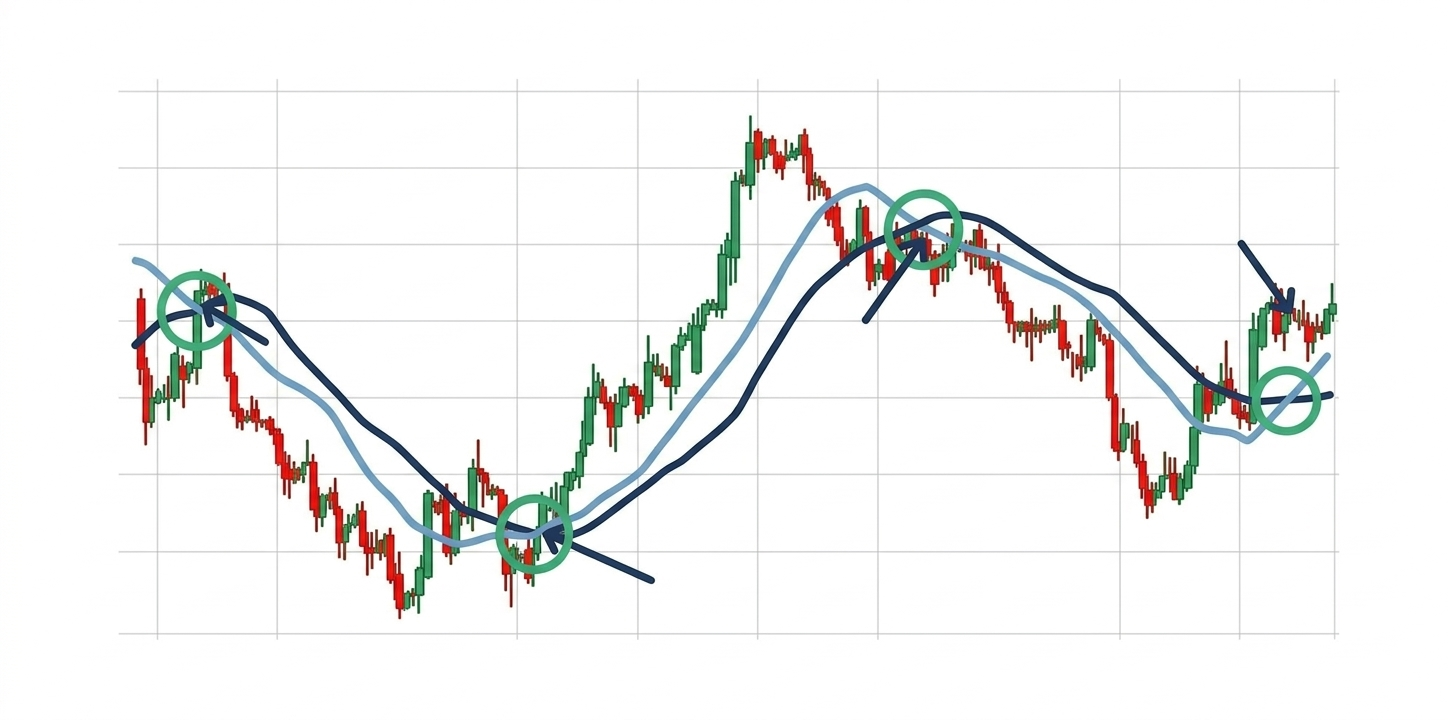
The light blue line shows the fast MA (recent price), while the dark blue line shows the slow MA (trend).
When the short-term MA crosses above the long-term MA, it indicates increasing momentum and a potential upward trend. When the short-term MA crosses below the long-term MA, it means recent prices are falling faster than the long-term trend, signaling a possible downtrend.
MA crossover patterns in crypto trading
Moving averages are commonly used to determine entry, exit, or hold positions. Common MA crossover patterns in cryptocurrencies such as Bitcoin (BTC) and Ether (ETH) include:
- Golden Cross: Occurs when a short-term MA (often 50-day) crosses above a long-term MA (typically 200-day), signaling a potential uptrend.
- Death Cross: Occurs when a short-term MA crosses below a long-term MA, indicating a potential downward trend or correction.
Due to higher volatility in crypto markets, shorter periods such as 20-day and 50-day MAs are often used to capture faster momentum shifts.
How reliable is the moving average crossover strategy
The MA crossover strategy is widely used because it is simple and practical. However, market conditions have a strong impact on its success. The strategy works best when prices move steadily in one direction, such as during a long-term uptrend.
In sideways markets, trading based on crossovers can lead to more losses. In low-volatility or sideways conditions, frequent crossovers can generate false signals.
Another limitation is signal lag. Moving averages are based on past prices, so signals may appear after much of the move has already happened. Combining MA crossovers with other market data, such as trading volume, can help improve accuracy.
Summing up
The goal of the moving average crossover strategy is to identify trends and see the bigger market picture by smoothing out daily price changes. Crossovers provide useful insights into price movements, but reliance on a single indicator may reduce accuracy.
Explore EMCD Academy for beginner-friendly crypto and finance courses with clear, practical explanations.
FAQ
How are moving averages used in trading?
Moving averages are used to confirm trends, with crossovers signaling potential changes in price direction.
What are the best moving average settings?
There’s no single best setting—common choices include 20, 50, and 200 periods, depending on whether the focus is short-term or long-term trends.
What are the pros and cons of MA crossovers?
MA crossovers are simple and effective for identifying trends, but they can produce false signals in sideways markets and often lag behind price movements.
When are moving averages most effective?
Moving averages are especially useful in trending markets, where they help traders identify direction and follow sustained price movements.