How to Read Candlestick Charts: A Beginner's Guide
Candlestick charts represent price movements over a specific timeframe. Originating in Japan in the 18th century, they are now widely used in technical analysis across different markets — from crypto and stocks to commodities and forex.
Combined with other analytical tools, candlestick charts help traders identify patterns and understand market sentiment. This guide explains how to read candlestick charts for beginners and how to interpret the signals behind common patterns.
What Is a Candlestick?
Candlesticks are individual data points that, when sequenced together, form a chart. A candlestick is a visual element, shaped like a brick, that summarizes price data.
Traders often analyze a single candlestick to get insight into what happened during a set period of time, which can be 1 minute, 1 hour, 4 hours, several days, or a month, depending on trading style. A daily candlestick chart for Bitcoin from TradingView, for example, may look like this:
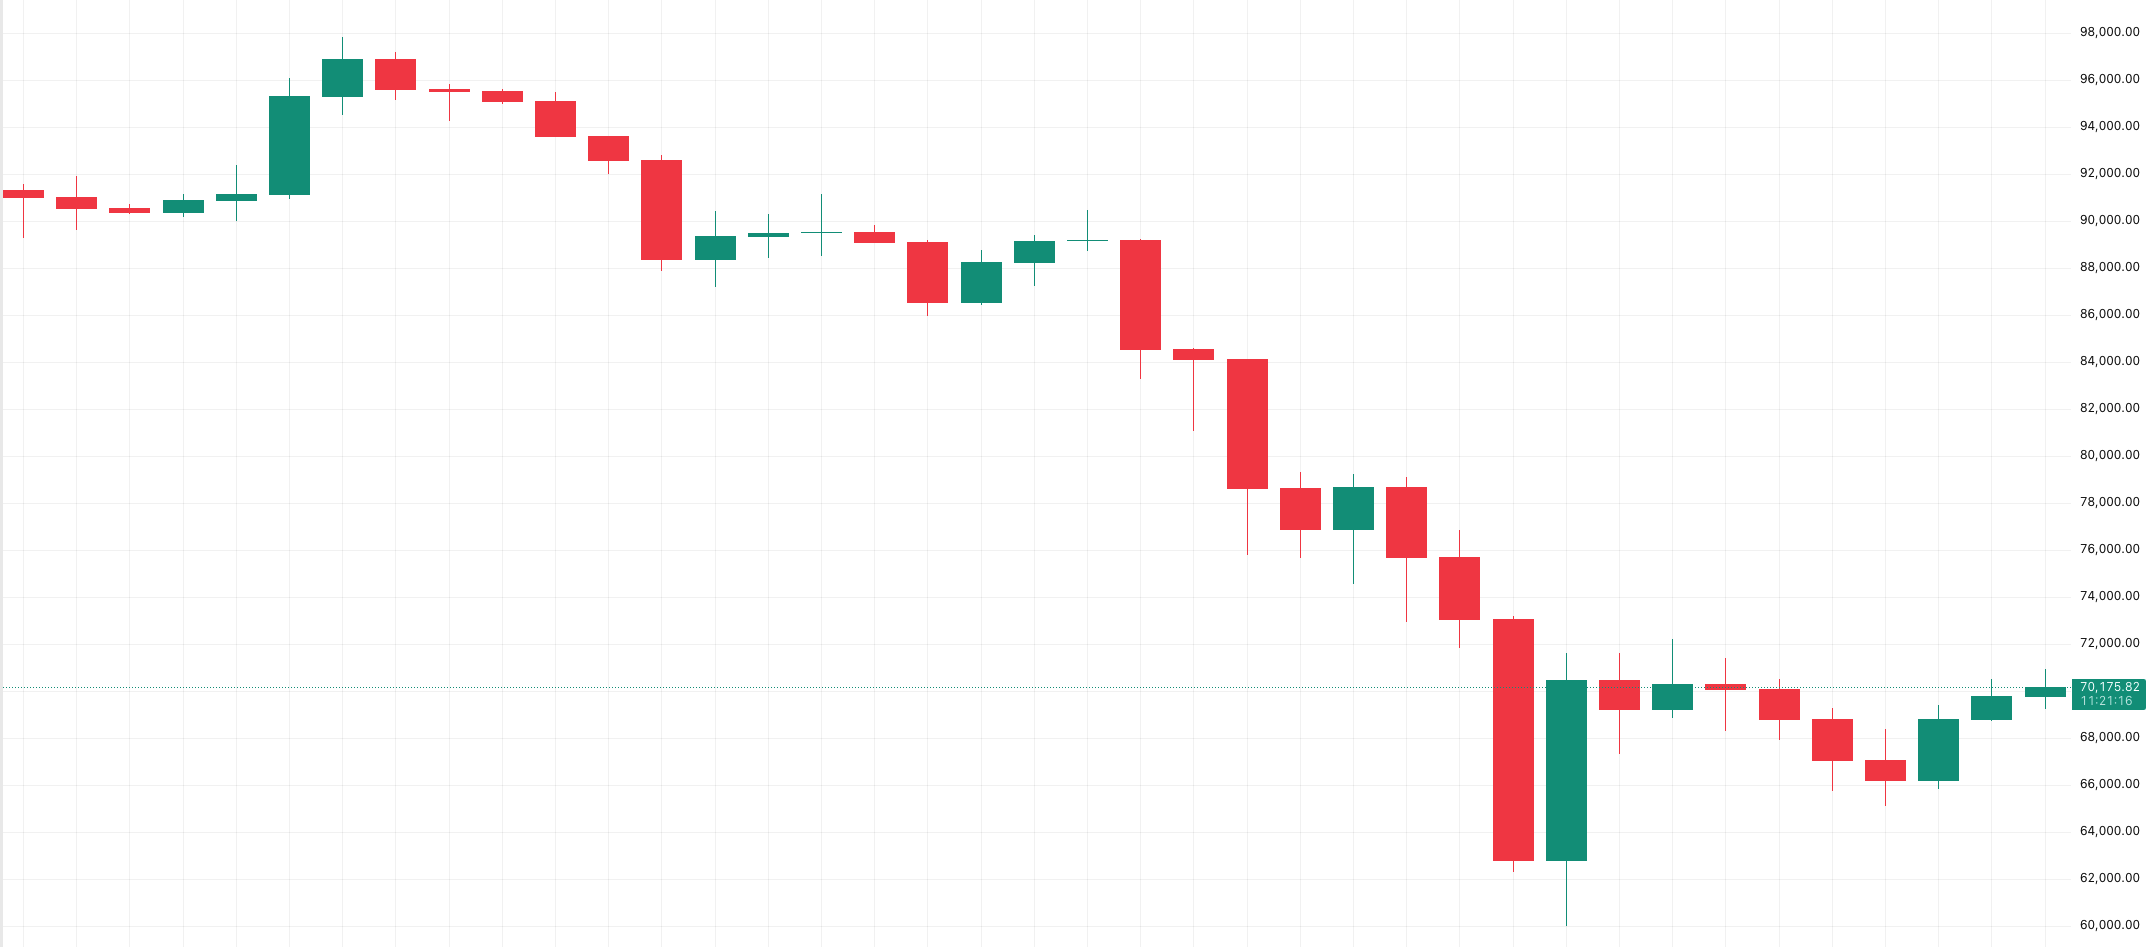
As shown in the chart, candlesticks vary in color and size, reflecting shifts in price direction and market strength.
The Main Parts of a Candlestick
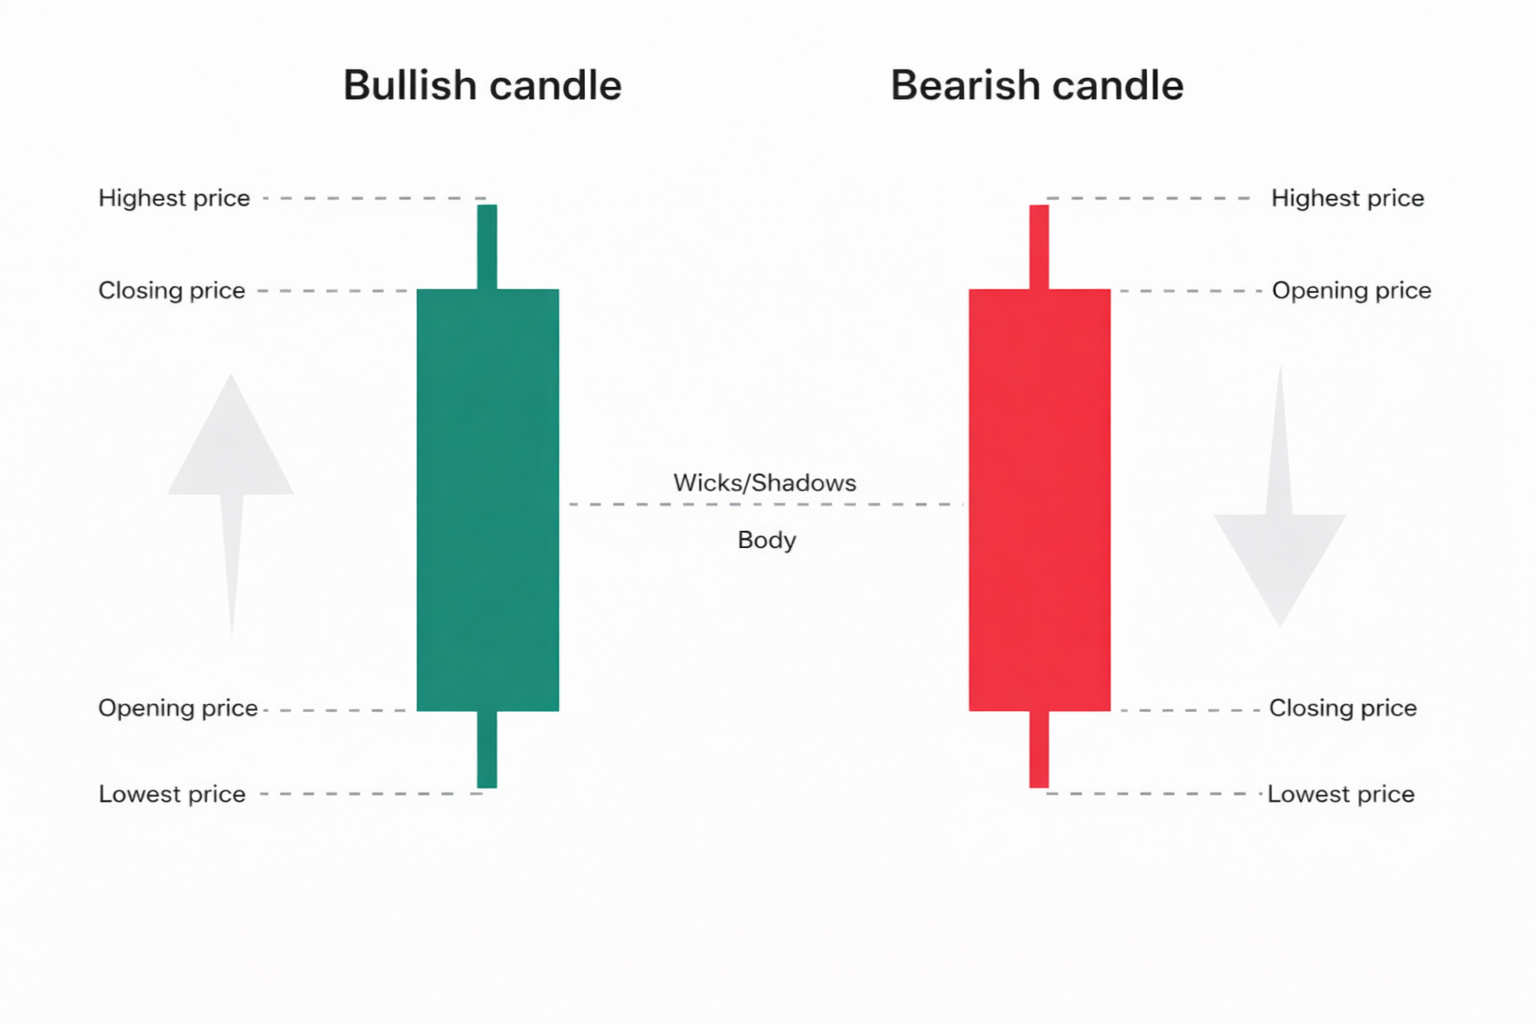
Each component of a candlestick reveals details of how the price moved during a specific period.
- Body — the thick central rectangle of the candlestick, showing the opening and closing prices for the period. The bottom of the body shows the lower of the opening or closing price, while the top represents the higher.
- Wicks or shadows — thin lines above and below the body. The upper wick shows the highest price reached, and the lower wick shows the lowest price reached during the period. The total length of the wick reflects volatility and whether the price moved more toward the high or the low. Short wicks indicate the market is moving steadily in one direction, while long wicks show the price was pushed back at certain levels.
- Length and color — larger red candles indicate strong selling pressure, while green candles show buying activity.
Candlestick Patterns Explained
Patterns form when several candlesticks line up in a specific sequence, reflecting price behavior. The main driver of price movement — and therefore pattern formation — is human psychology, which tends to repeat in cycles.
For example, panic can produce long red candles, signaling strong selling pressure. During periods of Fear of Missing Out (FOMO), buying activity increases, and green candles dominate. Beginners should understand that patterns reflect market sentiment and generally fall into four common groups:
- Bullish patterns: signal potential upside or a reversal from a downtrend
- Bearish patterns: signal potential downside or a reversal from an uptrend
- Neutral / indecision patterns: indicate market hesitation or balance between buyers and sellers
- Continuation patterns: suggest the existing trend is likely to continue
Common Candlestick Pattern Types for Beginners
- Engulfing: A two-candle pattern where the second candle fully covers the first. A bearish engulfing occurs when a red candle overtakes a prior green candle, showing sellers are in control. A bullish engulfing occurs when a green candle overtakes a prior small red candle, showing buyers dominate the market.
- Doji: A cross-shaped candle that forms when the opening and closing prices are almost equal. It shows market indecision before a possible continuation or reversal.
- Morning Star / Evening Star: Three-candle pattern signaling a trend reversal. A Morning Star forms after a downtrend with a red candle, a small indecision candle, and a strong green candle. An Evening Star is the opposite — green candle, small indecision candle, then a strong red candle.
- Hammer: A single-candle pattern with a small body at the top and a long lower wick, appearing after a price drop. Sellers push prices down, but buyers reject the lows and regain control by the close, signaling a potential upward reversal. The inverted hammer is similar but flipped — small body at the bottom with a long upper shadow — also indicating a bullish reversal as buyers test higher prices.
As you learn to read candlestick charts, you'll see other common patterns like the Harami, the Three White Soldiers, the Shooting Star, and more.
Candlestick Trading For Beginners: Tips for Reading Charts
Candlesticks can be used across different trading styles, including day trading, swing trading, and long-term investing. Beginners need to outline their strategy to make the best use of charting tools. The following simple steps can help get started:
- Focus on Market Trends and Key Levels
There’s no need to memorize different pattern names at once. Spotting price structure and then recognizing and interpreting patterns helps determine whether prices are moving upward, downward, or sideways. Key indicators to watch include support and resistance zones — areas that act as a floor or ceiling, where the market tends to pause or reverse. - Understand the Context
Candlesticks are part of a bigger picture. A single pattern viewed in isolation may be misleading, but within context, it can help indicate where prices might move. Context includes factors such as recent market volatility, trading volume, news events, and overall market sentiment. - Analyze Different Timeframes
The reliability of a pattern also depends on the timeframe. A bullish pattern on a 15-minute chart might seem less convincing if the daily chart shows a strong downtrend. Using larger timeframes — typically above 1 hour — can help beginners reduce risk. - Be Aware of Trader Traps
Sometimes a pattern forms, but the price reverses in the next candle. Waiting for confirmation to see if the trend continues increases the probability of a successful trade. Each cycle can be different from the previous one. In addition, the market can make sudden moves or false breakouts that patterns alone cannot predict.
Bottom Line: Are Candlestick Patterns Reliable?
Candlestick patterns offer a clear visual representation of price action and can help spot trends, reversals, and market momentum. When paired with trading volumes, fundamental analysis, and other tools, traders can better interpret market signals and possible scenarios. While candlestick analysis can be useful, it does not provide guaranteed outcomes.
Join EMCD Academy for free beginner-friendly crypto and finance courses. Expand your knowledge with clear, practical explanations.
FAQ
How to Start Using Candlestick Charts in Trading?
Start with the basics. Focus on identifying key trends, price structure, and overall market direction. Learn how to read common patterns before moving on to more complex ones.
Are Candlestick Patterns Still Relevant in 2026?
Candlestick patterns remain relevant, giving a clear visual of price behavior and market psychology. In modern trading, you can also rely on pattern-recognition software, volume analysis, and demo accounts to practice.
What Timeframes to Choose for Candlestick Analysis?
Larger timeframes like daily or 4-hour charts tend to be more reliable for beginners because they show clearer trends and reduce false signals.
How to Choose the Best Candlestick Charting Guide for Trading?
The choice depends on a trader's level and goals. If you're new to trading, look for a trading guide for dummies that uses clear examples, explains trends and context, and outlines steps to get started. For pros, the best charting guide will provide advanced tools and techniques.
What Mistakes Do Beginners Traders Usually Make?
The biggest mistakes are: trusting patterns without checking context, ignoring the bigger trend, acting too quickly without confirmation, and using very short timeframes that create false signals.